In this article, I would like to leave some comments from option market perspective. First, let's see the Open Interest chart from our #optionM8 app.
 |
| QQQ OI 171103 |
If you check the 5min chart of QQQ 171103 150C, you will find that someone sold 34000 of 150C at $1.24 between 10:45 and 10:50 on this day. That is $4.2M of bet for QQQ closing below 150 on next Friday.
Coincidentally, QQQ started surging immediately after this 150C was sold to open. One can argue that this call seller was forced to buy cash QQQ for delta hedging. If this were the case, we could ignore this 150C open interest, however, if this seller has big balls, QQQ would pull back to 150 or less by next Friday so that the 150C seller could pocket $4.2M of premium.
Remember. Selling CALLs is highly risky business, unless it's hedged, or, ... the seller would know something we don't know. I won't get surprised if I see QQQ would pull back to 150 level by next Friday.
There was one more interesting thing on last Friday. RSP, equal weighted version of SPY, ended flat and negative on weekly chart.
 |
| RSP Daily |
 |
| RSP Weekly |
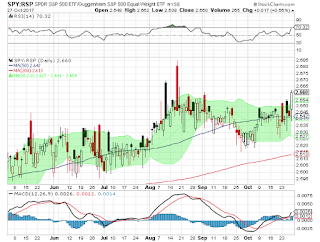
The next chart is SPY:RSP ratio. I added B-Band to see how the last Friday was unusual.
 |
| SPY:RSP Ratio daily |
If we can expect mean reversion for SPY:RSP, we would see QQQ's pullback this Monday or Tuesday. Since much of SPY's advance last Friday was accounted by QQQ, we could expect SPY's pullback as well.
 |
| SPY OI 1101 |
 |
| SPY OI 1103 |
The problem is in 1103 OI. There are HUGE 257C LONGs as well 257P SHORTs. Those 257C longs would start closing their position once SPY starts pull back. When many calls are sold, the stock price tends to decline.
 |
| SPY 1103 257P 5min |
If SPY breakdown 257 and SPY 1103 257P moves above $0.73, which is not so far away, the seller of 257P would start selling cash SPY or buying back 257P, ether of those options creates down pressure on SPY.
The good news is that there are lots of 256P Longs floating and they would close their position once there 256P rises back above VWAP. We would find relatively strong support between 255 and 256 next week.
Happy Trading.


No comments:
Post a Comment